Updated January 11, 2023
Reading Time: 5 minutes
In Your Users’ Eyes
You’ve picked the perfect keyword. You’ve written the perfect page. Yet your Web Analytics isn’t painting a rosy picture. High bounce. Low time on page. Zero conversions. What’s a digital marketer gonna do? First, examine a heat map to get a view of what users actually see (and scroll to) on their desktop, tablet, or mobile device. Then, it’s time to dig into visitor recordings for insights on how to make on-page optimization tweaks.
Heat Map & Visitor Recording Fundamentals
The beauty of visitor recording software is that it allows you to watch how people interact with your website pages. In analyzing our clients’ sites, as well as our own, we use HotJar; we prefer it because it’s affordable and relatively easy to use. Whichever system you use, there are a few fundamentals to keep in mind:
- When you significantly modify a page, like changing the layout or move a CTA button, pause the original page’s heat map. Then, create a new heat map. Heat maps become inaccurate when overlaying more than one version.
- Be descriptive in your heat map names, especially if you’re doing A/B testing. When sifting through your heat map directory, it will help you quickly identify variations. Trust me on this point. When you actively use heat maps to analyze your content, it’s easy to create a long list. Detailed descriptions will help with version control.
- Monitor your account limits. Most systems limit the number of recordings it will store. In HotJar’s case, it will continue to collect heat map data but won’t collect individual visitor recordings if you’ve hit your maximum.
- Exclude home and office IPs to avoid skewing the data. Be sure to add any internal team members as well as digital marketing agencies and consultants.
- Confirm heat maps and visitor sessions are recording. Once you add the tracking code to your website, double-check that sessions are recording to avoid disappointment.
Start With A Question In Mind
To analyze visitor recordings for on-page optimization, I suggest having one or two questions in mind before you watch any recordings. Otherwise, the viewing process is overwhelming. Focus on a specific question; for example, on “x” page, what content is most read by visitors? Besides the primary CTA, where else are visitors interacting with the page? Then as you view each individual recording, you’ll begin gathering your answers. This technique — starting with one or two specific questions — is an excellent way to dig into Google Analytics and Search Console data.
As you view each individual recording, you’ll begin gathering your answers. This technique — starting with one or two specific questions — is an excellent way to dig into Google Analytics and Search Console data as well.
[hana-code-insert name=’CTA-SEO-Audit’ /]Tips for Viewing Efficiency
In comparing visitor recording software, I’ve found that each has similar features. To get the most of your analysis, use:
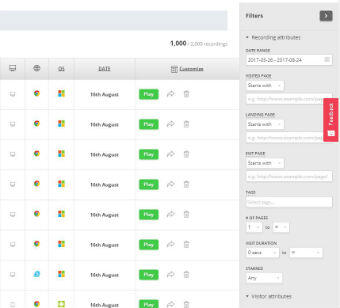
- Filters. For efficiency, sort your recordings to narrow your to-view list. There’s no point in sifting through sessions not related to the questions you want to answer. You can filter by date range, number of pages viewed, duration, start or exit page, or an exact URL match. To start, I suggest selecting recordings that contain the page URL regardless if it’s at the start or end of a recording session. Most systems also let you filter by country, device type, operating system, and browser. You can even search on specific user IDs to see if repeat visitors behave differently.
- Tagging, Notes & Stars. Tags are useful in marking recordings that have something in common. For example, if images don’t render correctly. Depending on the system you use, you can also make notes related to a specific session. Starring sessions is another way to designate and sort sessions. Each recording also has a reference number.
- Cursor Movement. The software records where users tap and move their cursor. Typically readers use their mouse to mark their progress down a page. Do they hover over specific content for more than a few seconds? You’ll get a sense of what information on the page holds a visitors attention. Or not.
- Viewing Speed. When first viewing sessions, it’s helpful to watch in actual speed (.5 to 1x). There’s a surprising amount of detail to take in — how a user interacts with the nav bar, scrolling behaviors, how a page renders for their device configuration, etc.
- Skip Pauses & AutoPlay. Once you’ve got the hang of watching recordings, you’ll want to speed things up to cover more ground. You can skip pauses and set recordings to autoplay. Even so, be ready to pause as you’ll want to take notes and tag recordings as they fly by. Personally, I find skipping pauses to be distracting as the recording feels jumpy and not how visitors naturally interact with a site.
Connecting the Visitor Data Points
Visitor recordings are a powerful way to see your content through users’ eyes. The data collected with heat maps and session recordings provide insight so you can better optimize a page. Yet, don’t forget there are other valuable content analysis tools. When analyzing content, I also use Google Analytics and Search Console in order to find other pieces of the puzzle, such as:
- Value of the page towards a conversion. This works if you assign a dollar figure to your GA goals.
- Average session duration and what’s the trend over time. Are the changes to content or how it’s organized improving a users experience?
- What percentage of visitors exit on this page? This could point to a CTA problem.
- How visible is the page in search by looking at average SERP position and impressions?
- Compare the search console metadata’s CTR in Search Console to Google Analytics’ bounce rate. Your metadata sets an expectation with a potential visitor. If the CTR is high (visitor is interested) and the bounce is high, you’re not delivering on what you promised.
- What keyword(s) does Google think is on the page? Does your content best match the keyword and visitor expectations? Are there other competing pages on your website for that same keyword?
- What other pages complement the user experience? Do you make it easy for a reader to dig deeper into a subject as they get closer to a buying decision?
Filter Out the Noise
Another interesting feature (launched in March 2019) from Hotjar is the ability to add multiple positive and negative filters to your recording. So if you want to look at visitors who visited your home page, but didn’t visit your about page, or your checkout page, you can now do that easily. Then, if this filer combination is something you find yourself looking at often, you can save it as a segment. Making it easier to set up next time you’re looking at your data in Hotjar.
Using all the tools available to you will help get a clearer image of a page and it’s performance. As with anything on the web, achieving perfection is an iterative process. How do you use visitor recordings to analyze your website’s content?
Photo credit – Top: Ben Mortimer
Photo credit – Middle: Alyson Harrold
Photo credit – Bottom: Ellie


 What is Content Ideation?