Updated December 9, 2021
Reading Time: 2 minutes
In our Google Analytics Part 1 of this two-post series we equated not reviewing and understanding your Web Analytics program to a business running without financial reports like a P&L or balance sheet. If you don’t understand your website’s performance or it’s not configured properly, you are flying blind. Here are the 3 remaining changes Google made to Google Analytics we believe you should know:
3. Mobile Ad Performance
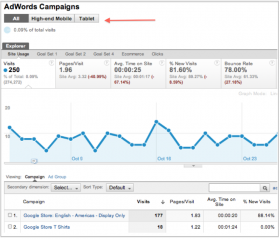
More and more consumers are using tablets and SmartPhones to search, view websites and conduct business. Therefore, mobile advertising is becoming an essential piece of your digital portfolio. As a response to this ever-growing popularity, Google Analytics has added mobile ad performance data so businesses can optimize their advertising efforts. AdWord metrics can be segmented so you can see the difference in how your ads perform when users are presented via a traditional or small screen view.

4. Tracking Downloads
When you have downloadable items on your website (like a white paper or checklist), you set up Google Analytics Event Tracking. By doing so, it provides data on how many people downloaded the item, where they came from (e.g., search engines, social media sites) and what keywords they used to find it. Don’t have downloaded items on your site? We’d recommend putting that on your to-do list.
As part of the GA update, you now have the ability to track non-interaction events. So what does that mean in plain English? Imagine you have a banner with rotating images and corresponding text for services you provide. Perhaps one or two of those images resonate with your target audience but you’re not sure which ones. GA now allows you to set up these passive events and analyze that information. You can also do some A/B testing to fine-tune your banner to increase the length of time a visitor stays on your site thus improving your chances for lead conversion.
5. Tracking Visitor Flow
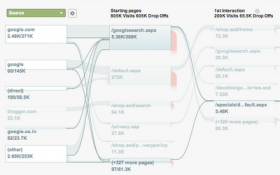
This feature is particularly good news for folks who are visual. Visitors Flow provides a graphic representation of how visitors navigate through a website, tracking which page they landed on first and where they went next. I routinely tell my clients that all pages on a website is a potential landing page, and this visual diagram illustrates that point.

The new Google Analytics interface offers easier access to the gold nuggets of information you can use enhance your website. In the past, GA changes were sporadic. My prediction is that changes will occur more regularly, so stay tuned…

 Google Analytics: Are You Flying Blind? Part 1